An oscilloscope is an instrument to display signal voltages, plotted against time (Yt) or against another signal voltage (XY). A benefit of graphically showing signals is that oscilloscopes will show what is actually happening. The precise shape of the signal and time relations in the signal or between signals can be seen.
Oscilloscopes displays electrical signals, but with the proper sensors, other quantities like temperature, movement, etc. can be measured as well.
A scope has many applications, in many different areas. An important application of oscilloscopes is to troubleshoot circuits that do not function properly. Another possible application is using the lab scope as signal monitor when adjusting a circuit under test.
Features of the Multi Channel software oscilloscope
The oscilloscope function in the Multi Channel oscilloscope software has the following features:
Oscilloscope graphs
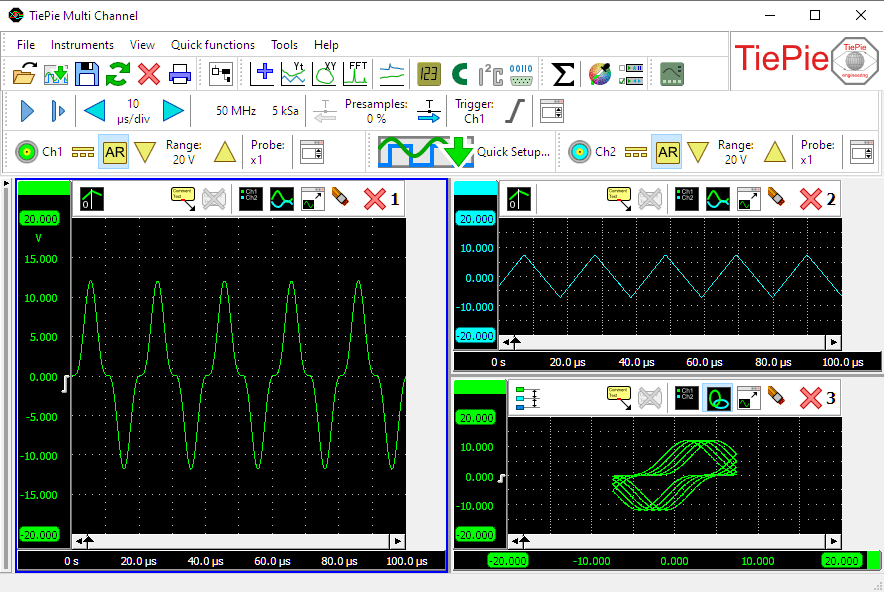
The oscilloscope can have one or more graphs, each displaying one or more signals, where each graph can display different parts of a signal. Graphs can display the signal(s) in Yt mode or in XY mode, with or without interpolation. Colors of all items in a graph can be set to any required value. Graph dimensions can be adjusted to any required size, graphs can be located in one single window or in separate windows, which can be located anywhere on the desktop.
Cursors are available in the oscilloscope to make on screen measurements, as well as a t=0 line to indicate the trigger moment. Signals can be given descriptive names and a legend is available to simplify identifying the displayed signals. Text labels can be placed to mark interesting parts of the signal(s).
To reveal all details of the measured signals, the oscilloscopes offer unlimited zooming in both vertical and horizontal direction. All zoom actions can be undone with an undo zoom function.
Convenient settings windows
To setup the instrument and the channels, convenient instrument settings windows and channel settings windows are available. They give access to all relevant settings of the instrument and channel, making easy tweaking of settings possible.
Touchscreen friendly toolbars
An instrument toolbar and channel toolbars are available for each detected instrument. The convenient toolbars provide clear buttons for all settings of the instrument and its channels. They show the current settings of the instrument and allow to change all settings. The large buttons are very suitable for touchscreen operation.
The toolbars are fully configurable through the program settings. You can set the button size, add or remove buttons and change the order of the buttons.
Mathematical operations in the oscilloscope
Various mathematical operations can be performed on the measured data. Basic mathematical operations that can be performed in the oscilloscope are:
- Adding/subtracting
- Multiplying/dividing
- Differentiating
- Integrating
- Determining the square root of a signal
- Determining the absolute value of a signal
These operations can be combined in any thinkable way. The result of a mathematical operation can be displayed in a graph and can also be used as input for another mathematical operation.
More complexe mathematical operations that are available are:
Storing oscilloscope data
Measurement data can be stored in various different ways:
- Saved to disk in various different data file formats
- Printed, with customizable layout and colours
- Stored as image file, in various common formats
Oscilloscope controls
Controlling the oscilloscope is done through customizable instrument and channel toolbars, through instrument and channel settings windows and popup menus and by hotkeys. A quick function toolbar is available for often used functions.